Index of Agreement
The Index of Agreement, introduced by Willmott in 1981, stands as a standardized metric for quantifying the degree of prediction error in models, offering hydrologists a valuable tool for assessing model performance. This index, denoted by 'd', ranges between 0 and 1, where a value of 1 signifies a perfect match between model predictions and observed data, while a value of 0 indicates no agreement whatsoever.
Fundamentally, the Index of Agreement serves as a normalized gauge of prediction error, derived from the ratio of mean square error (MSE) to potential error. This calculation affords a holistic evaluation of model performance by considering both systematic and random disparities between observed and modeled data. In essence, it provides a comprehensive assessment by accounting for various sources of error, thereby offering insights into the overall accuracy and reliability of the model.
One notable advantage of the Index of Agreement is its ability to discern additive and proportional differences in the means and variances of observed and simulated data. This capability allows hydrologists to identify and address discrepancies stemming from both systematic biases and variability in the data.
However, it's important to note that the Index of Agreement (d) is susceptible to the influence of extreme values, as it relies on squared differences between observed and simulated data. Consequently, extreme outliers can disproportionately impact the calculated index, potentially skewing the assessment of model performance.
Despite this limitation, the Index of Agreement remains a widely used and valuable tool in hydrological modeling, providing a standardized and interpretable measure of model accuracy that accounts for both bias and variability in the data. By incorporating the Index of Agreement into their evaluations, hydrologists can gain deeper insights into the strengths and limitations of their models, guiding improvements and enhancing the reliability of their predictions.
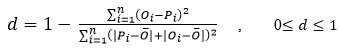
where Oi is the observation value and Pi is the forecast value and Obar is the average observation values and Pbar is the average forecast values.
How To Cite
Please provide the data in a two-column format (observed vs. simulated). You can copy from Excel, text, or any other format, separated by space.